Performance
Each result includes its command. A cold install through peryx costs about the same as a direct pypi.org install. A warm install is faster than pypi.org and bounded by installer CPU instead of network latency. See performance and methodology for the shared test controls.
| model | Mac16,10 |
|---|---|
| CPU | Apple M4 (arm64) |
| cores | 10 (4 performance + 6 efficiency) |
| memory | 16 GB |
| OS | macOS 26.5 Tahoe (kernel 25.5.0) |
| mount | disk | size | role |
|---|---|---|---|
/System/Volumes/Data |
SSD, apfs | 245.1 GB | benchmark scratch: every server's store and cache ; benchmark target |
/Volumes/T9Mini |
SSD, hfs, removable | 2.0 TB | the checkout the peryx binary is built and run from |
| single | 8 parallel | measures | |
|---|---|---|---|
| memory copy | 44.3 GB/s ±2% | 52.9 GB/s ±1% | moving bytes between two buffers larger than L2 |
| disk write | 1.5 GB/s ±17% | 1.8 GB/s ±3% | a sequential write to /System/Volumes/Data (SSD), flushed to the device |
| file read, warm | 15.4 GB/s ±7% | 31.3 GB/s ±2% | reading a file on /System/Volumes/Data (SSD) that the page cache already holds, as a warm registry does |
| minimal HTTP server | 10.2 GB/s ±3% | 7.1 GB/s ±2% | a 30 MB body over 127.0.0.1 from a server that only writes a buffer |
Benchmark setup
The workload installs the 51 most-downloaded packages on PyPI, torch among them for one large wheel, into a fresh virtualenv with a fresh installer cache, so every byte must come through the index:
uv venv --python 3.14 fresh-venv
env VIRTUAL_ENV=$PWD/fresh-venv UV_CACHE_DIR=$PWD/fresh-cache \
    uv pip install --index-url http://127.0.0.1:4433/root/pypi/simple/ \
        --only-binary :all: boto3 urllib3 botocore requests numpy pandas ... torch
--only-binary :all: keeps the run honest. Without it a package that ships no wheel for the interpreter is compiled
from source, and that build lands inside the measured install, dwarfing anything the index server contributes.
Setup: peryx release build and the client on the same Apple Silicon machine, roughly 700 Mbit/s to PyPI's CDN. Each cell is the median over three independent rounds, each restarting the server on empty state; "cold" is that empty first pass, "warm" reruns against the now-full cache. Every server is torn down with its whole process group between rounds, so a forked worker cannot outlive its round and steal CPU from whoever is measured next. See performance and methodology for how the rounds, spread, and network-bound rows are handled.
| Scenario | Wall time | What dominates |
|---|---|---|
| uv direct to pypi.org | 3.7 s | the network, end to end |
| through peryx, cold cache | 4.4 s | the network; peryx adds about one hop |
| through peryx, warm cache | 3.3 s | uv itself, unzipping and installing wheels |
An install is a blunt instrument for measuring an index server. uv's own resolve, unzip, and install work dominates the wall clock, so every cache lands within a second or two of the others, and a faster index cannot rescue a slow client. The rows that actually isolate the server are the request swarm and the file throughput further down, where peryx answers 571 requests a second against direct's 215, holds a 9 ms p95, and serves a thousand of those requests on 2.6 s of CPU where devpi needs 13.4 s.
A laptop next to its cache is the least favorable setup for the warm numbers: the farther your machines sit from PyPI (CI in a private subnet, an office behind one uplink), the more the warm path wins, because it replaces your worst network hop instead of a loopback.
Compared servers
The comparison includes every alternative that starts hermetically from a package. Direct means uv talking to pypi.org without a proxy and provides the baseline for each ratio. The benchmarks measure cache-miss data paths and concurrent misses. The comparison derives both behaviors from each server's source.
| Server | Deployment | On a miss | Persisted cache | Private uploads |
|---|---|---|---|---|
| peryx | Single process | Streams to the client and store | redb plus content-addressed blobs | Scoped tokens per index |
| devpi | Application plus reverse proxy | Parses pages; streams files | SQLite keyfs plus sha256-addressed files | Per-user ACL |
| proxpi | Application server | Downloads to a temporary directory | In-memory index and files on disk | None |
| pypiserver | Single process | Redirects to pypi.org | None | htpasswd per directory |
| pypicloud | Python, Pyramid, waitress | Buffers, stores, then serves | SQLite or remote metadata plus files | User and group access |
Cache-miss data path
The cold rows measure how each server moves an uncached wheel from pypi.org to the client.


- peryx never buffers a whole response. Page and artifact bytes stream to the client and into the store at once; peryx transforms a page chunk by chunk mid-flight, and tees a wheel to a temp file, hashes it, and renames it into the store once the client already has its bytes. A miss costs upstream wire time plus one hop. That sets the cold-install and cold-throughput numbers.
- devpi handles artifacts much as peryx does.
FileStreamerwrites each chunk to a local file and yields it to the client, then commits the sha256-addressed file once the body completes. Simple pages take the slower route: devpi fetches the upstream page, parses it, writes the link list into its SQLite keyfs, and only then renders a response from its own store. On PyPI-sized pages that parse-and-store step is real work on every refresh, and it runs under a single-writer transaction model. - proxpi downloads a missed file to disk in a background thread while the requesting client blocks on
thread.join(0.9 s); if the download outruns thatPROXPI_DOWNLOAD_TIMEOUT, proxpi redirects the client to pypi.org and lets the thread finish caching for next time. Its file cache defaults to atempfile.mkdtemp()that gets deleted on shutdown, so without a configuredPROXPI_CACHE_DIRthe cache does not survive a restart. proxpi serves cached files from disk viasend_file, not from an in-memory blob. The resident memory in the resource rows comes from four gunicorn worker processes, each holding its own unshared in-RAM index cache. - pypiserver serves a directory of your own packages; with
--fallback-urla miss is a bare302redirect to pypi.org's simple page. It downloads and caches nothing. That is why its CPU sits near zero and its cold and warm columns barely move: there is no cache to warm, and a miss is a formatted redirect string. - pypicloud was the closest design to peryx (a
fallback = cacheread-through mirror), but its cold path fully buffers. It pulls the entire upstream file into aTemporaryFile, computes hashes, writes it to storage and a row into its cache DB, and only then sets the response body. The client waits for the download, the disk write, and the DB commit before its first byte. pypicloud stores files byname/version/filename, not by hash. The project has been archived since 2023 and runs only under Python 3.10 with SQLAlchemy pinned below 2.
Only peryx serves PEP 658 .metadata by default (and
synthesizes it with byte-range reads when an upstream lacks it); proxpi
proxies it when the upstream advertises it, devpi hides it behind an experimental --enable-core-metadata, and
pypiserver and pypicloud do not serve it at all. This drives the warm-resolution numbers: a resolver comparing ten
versions fetches kilobytes from peryx and megabytes of wheels from the servers that cannot offer the sibling.
Concurrent cold bursts
The parallel-install and throughput cold rows send concurrent requests for the same uncached object. peryx uses single-flight, so misses for one page or file share one upstream fetch. Two competitors fail under this load.
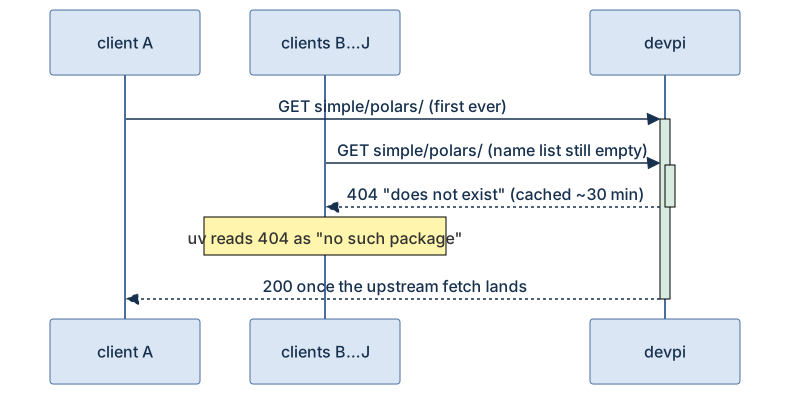
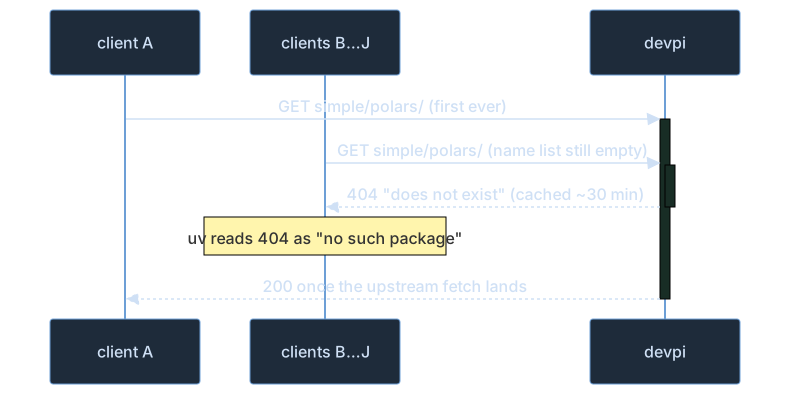
devpi, the empty first page. On the first concurrent fetch of a project, a request that loses the internal name-list
lock evaluates the project against an as-yet-empty project list, concludes it does not exist, returns a 404, and
caches that negative result for the mirror-expiry window (30 minutes by default). uv reads the 404 as "no such
package" and the install fails.
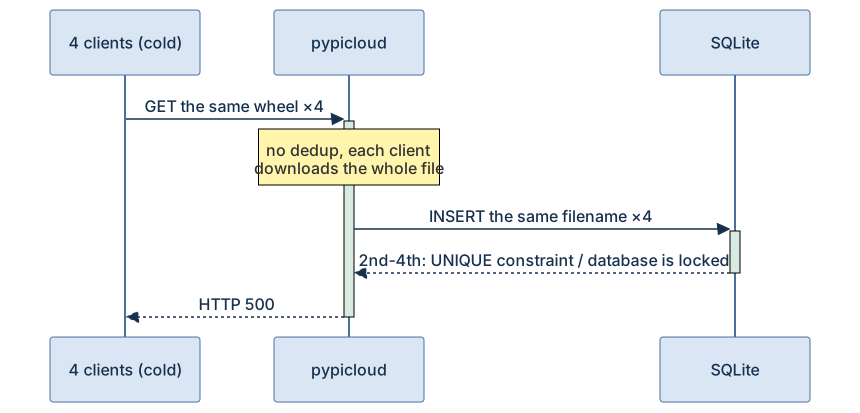
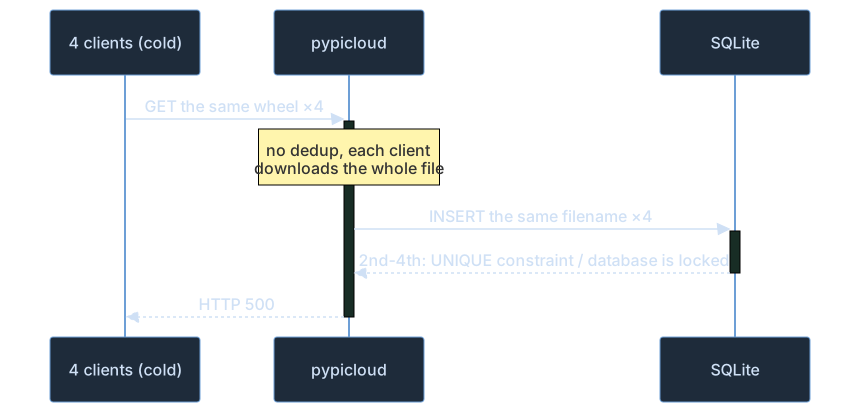
pypicloud, the concurrent INSERT. The cache-on-miss path has no dedup and no locking. Four clients asking for one
wheel each download the whole file, then each try to write the same filename primary key into single-writer SQLite.
The commits serialize; the losers hit a UNIQUE constraint (or database is locked), and because
pyramid_tm commits after the view returns with no retry
configured, the exception surfaces as HTTP 500.
Read this way, each table below is a controlled test of one axis: cold latency, warm overhead, a concurrent cold burst, a fleet installing at once, a swarm reading pages. The architecture above says in advance which servers should struggle where.
Benchmark suite
The benchmark runner executes one workload against peryx and its competitors, then records process samples and reports. Cell colors rank each row. Parenthesized ratios compare each server with the no-proxy direct baseline. See run the benchmarks for source ownership and commands.
Root-catalog synchronization
The root-catalog benchmark generates exactly one million valid project names, serves one PEP 691 response over loopback,
and runs the same streaming parser, 10,000-name transactions, and generation swap as mirror sync --mode all. While the
sync runs, another runtime worker repeatedly reads an unrelated project record. The report includes wall time, upstream
request count, completed foreground reads, and their p99 latency.
Peak RSS includes the generated JSON and the loopback server's response buffer. Compare deltas only between revisions of this benchmark. The one-request assertion catches accidental refetches; the project-count assertion catches partial publication.
The table covers every alternative that can be started hermetically from a published package: peryx, devpi, proxpi, pypiserver (whose upstream fallback is a redirect rather than a cache), and pypicloud (archived upstream; it still runs, but only under Python 3.10 with SQLAlchemy pinned below 2). Pulp needs PostgreSQL plus four services, nginx_pypi_cache is a Docker configuration rather than a package, and Artifactory, Nexus, and the cloud registries need licenses or accounts, so none of them can be measured this way.
The install workload is the top 51 most-downloaded PyPI packages, including torch for one large wheel, installed with uv into a fresh virtual environment and client cache. Cold is the first install against a server with empty state; warm reruns it with the server's cache full and only the client reset.
| peryx | direct | devpi | proxpi | pypiserver | pypicloud | |
|---|---|---|---|---|---|---|
| cold cache net | 4.4 s ±6% (1.18x) | 3.7 s ±5% (1.00x) | 12.7 s ±12% (3.42x) | 5.5 s ±14% (1.49x) | 4.5 s ±1% (1.20x) | 7.0 s ±3% (1.88x) |
| warm cache | 3.3 s ±1% (0.90x) | 3.7 s ±2% (1.00x) | 4.3 s ±40% (1.19x) | 4.6 s ±12% (1.25x) | 4.5 s ±1% (1.24x) | 3.9 s ±2% (1.08x) |
| server CPU | 1.8 s ±4% (1.00x) | no server (n/a) | 17.2 s ±15% (9.71x) | 4.2 s ±13% (2.37x) | 56 ms ±9% (0.03x) | 3.5 s ±6% (1.99x) |
| server peak memory | 699 MB ±2% (1.00x) | no server (n/a) | 1,373 MB ±2% (1.96x) | 747 MB ±1% (1.07x) | 68 MB ±3% (0.10x) | 376 MB ±0% (0.54x) |
The same workload through pip tells a different story: pip installs serially and does its own work between requests, so the client dominates and every server lands within a few seconds of the rest. A faster index cannot rescue a slow client; through uv, the index is what you feel.
| peryx | direct | devpi | proxpi | pypiserver | pypicloud | |
|---|---|---|---|---|---|---|
| cold cache net | 25.2 s ±2% (1.24x) | 20.4 s ±1% (1.00x) | 27.7 s ±4% (1.36x) | 25.1 s ±5% (1.23x) | 21.7 s ±1% (1.06x) | 27.3 s ±3% (1.34x) |
| warm cache | 20.5 s ±13% (1.00x) | 20.5 s ±12% (1.00x) | 19.2 s ±4% (0.94x) | 25.8 s ±15% (1.26x) | 21.8 s ±1% (1.06x) | 19.6 s ±4% (0.96x) |
| server CPU | 5.5 s ±25% (1.00x) | no server (n/a) | 12.6 s ±7% (2.27x) | 7.5 s ±29% (1.35x) | 47 ms ±17% (0.01x) | 3.0 s ±3% (0.54x) |
| server peak memory | 464 MB ±7% (1.00x) | no server (n/a) | 1,325 MB ±2% (2.85x) | 662 MB ±8% (1.42x) | 68 MB ±3% (0.15x) | 379 MB ±4% (0.82x) |
The throughput workload moves one large wheel (torch, ~88 MB). The cold row is the moment a CI fleet fears: four clients ask for the same wheel the instant a release lands, and the server either fans one upstream transfer out to every waiter or serializes them. peryx runs the transfer as a detached task every client tails, so all four see their first byte in milliseconds and finish together in the time one download takes; pypicloud answers the same burst with HTTP 500. The hot rows measure how fast a cached wheel leaves the server, alone and under eight parallel readers. Every number past ~3 GB/s outruns a 25 GbE link, so those cells compare server efficiency, not anything a client on a network would feel.
| peryx | direct | devpi | proxpi | pypiserver | pypicloud | |
|---|---|---|---|---|---|---|
| cold cache: 4 clients, one wheel net | 1.0 s ±1% (0.24x) | 4.4 s ±8% (1.00x) | 4.0 s ±1% (0.90x) | 7.8 s ±1% (1.77x) | 3.9 s ±0% (0.87x) | 4.6 s (1.05x) |
| hot cache: single download | 5,526 MB/s ±4% (48.67x) | 114 MB/s ±6% (1.00x) | 1,333 MB/s ±5% (11.74x) | 5,323 MB/s ±11% (46.89x) | 114 MB/s ±1% (1.01x) | 2,716 MB/s (23.92x) |
| hot cache: 8 parallel downloads | 7,273 MB/s ±2% (64.08x) | 114 MB/s ±2% (1.00x) | 2,088 MB/s ±11% (18.40x) | 11,034 MB/s ±4% (97.21x) | 116 MB/s ±0% (1.02x) | 3,441 MB/s (30.32x) |
| server CPU | 412 ms ±2% (1.00x) | no server (n/a) | 2.4 s ±10% (5.89x) | 966 ms ±2% (2.34x) | 0 ms ±173% (0.00x) | 1.8 s ±48% (4.43x) |
| server peak memory | 44 MB ±1% (1.00x) | no server (n/a) | 1,254 MB ±4% (28.50x) | 293 MB ±1% (6.65x) | 68 MB ±3% (1.54x) | 279 MB ±34% (6.34x) |
The parallel-install workload is that fleet end to end: ten virtualenvs install polars at once, each with its own empty client cache, exactly like ten CI jobs landing on the same runner pool. The server sees ten simultaneous copies of every page and wheel request. This is where correctness under concurrency shows up next to speed: devpi fails eight of the ten cold installs, because concurrent requests for a project it is fetching for the first time see an empty page and uv concludes the package does not exist.
| peryx | direct | devpi | proxpi | pypiserver | pypicloud | |
|---|---|---|---|---|---|---|
| cold cache: 10 parallel installs net | 1.5 s ±11% (0.33x) | 4.5 s ±3% (1.00x) | error (n/a) | 4.4 s ±17% (0.98x) | 4.4 s ±1% (0.98x) | 5.4 s ±12% (1.18x) |
| warm cache: 10 parallel installs | 1.5 s ±1% (0.32x) | 4.5 s ±2% (1.00x) | error (n/a) | 1.9 s ±16% (0.42x) | 4.4 s ±1% (0.99x) | 2.4 s ±77% (0.53x) |
| server CPU | 673 ms ±7% (1.00x) | no server (n/a) | 247 ms ±109% (0.37x) | 1.2 s ±4% (1.80x) | 27 ms ±18% (0.04x) | 2.0 s ±10% (2.93x) |
| server peak memory | 182 MB ±8% (1.00x) | no server (n/a) | 1,175 MB ±0% (6.45x) | 324 MB ±1% (1.78x) | 67 MB ±3% (0.37x) | 229 MB ±5% (1.26x) |
The request workload drives a swarm against each warm server: one user, then 32, each a client that fetches project
pages and reads every byte of the body, the way a resolver does. The pages average ~480 KB, so this row prices full page
transfers, not header round-trips. Every client sends the Accept header pip and uv send, because peryx picks the
representation from it: a swarm asking for */* receives the PEP 503 HTML render
instead, which is not the page an installer ever gets, and prices work no install performs.
peryx answers 7,658 requests a second to a single client at a 2.3 ms p95, and 17,707 to thirty-two at 3.8 ms; the next-fastest local cache manages 176 and 752. The gap is the cached page: a warm hit is a lookup and a copy of bytes peryx has already transformed, so it serves a thousand of those requests on 168 ms of CPU where devpi spends 9.6 s and proxpi 6.3 s.
| peryx | direct | devpi | proxpi | pypiserver | pypicloud | |
|---|---|---|---|---|---|---|
| 1 user: requests/s | 7,658 req/s ±2% (128.49x) | 60 req/s ±7% (1.00x) | 107 req/s ±0% (1.80x) | 117 req/s ±2% (1.97x) | 65 req/s ±2% (1.09x) | 176 req/s ±4% (2.96x) |
| 1 user: p95 latency | 2.3 ms ±2% (0.06x) | 39 ms ±137% (1.00x) | 43 ms ±1% (1.10x) | 28 ms ±1% (0.70x) | 30 ms ±25% (0.75x) | 30 ms ±1% (0.76x) |
| 32 users: requests/s | 17,707 req/s ±5% (23.84x) | 743 req/s ±0% (1.00x) | 114 req/s ±1% (0.15x) | 583 req/s ±2% (0.78x) | 752 req/s ±0% (1.01x) | 186 req/s ±8% (0.25x) |
| 32 users: p95 latency | 3.8 ms ±6% (0.04x) | 93 ms ±3% (1.00x) | 307 ms ±2% (3.31x) | 59 ms ±45% (0.64x) | 307 ms ±14% (3.31x) | 196 ms ±9% (2.12x) |
| server CPU per 1k requests | 168 ms ±1% (1.00x) | no server (n/a) | 9.6 s ±1% (57.16x) | 6.3 s ±4% (37.62x) | 204 ms ±4% (1.21x) | 5.7 s ±3% (34.01x) |
| server peak memory | 108 MB ±6% (1.00x) | no server (n/a) | 1,193 MB ±0% (11.02x) | 394 MB ±2% (3.64x) | 68 MB ±3% (0.63x) | 201 MB ±5% (1.86x) |
Every table ends with two resource rows: the CPU the server's whole process tree burned while its workload ran, and its peak resident memory, compared against peryx (direct runs no server, so it cannot anchor them). The load table prices that CPU per thousand requests served, which is the only way to read it. A fixed-duration swarm hands the slowest server the smallest bill, and unnormalized it rewards failure: devpi answers 114 requests a second to peryx's 17,707, so its absolute CPU looks modest until you divide by the work done.
Read the ratios against direct with care here. Every other party is a process on this machine, while direct is
pypi.org across the internet, so its rows carry a wide-area round trip no local cache pays.
Speed alone hides a trade. proxpi's eight-way transfer lead comes from holding wheels in memory at nearly seven times peryx's 44 MB footprint, and pypiserver's near-zero CPU reflects that it redirects file downloads to PyPI instead of serving them.
Endpoint coverage
The client workloads cover the project page, wheel, and PEP 658 metadata endpoints. The endpoint benchmark measures one warm request to every other served endpoint.
It is peryx against itself, not against the field. A PyPI server chooses its own url shapes and decides what its index
root contains: pypi.org answers /pypi/{project}/json where peryx answers {index}/{project}/json, devpi addresses
files by an internal path, and a proxy's index root lists what it has cached while pypi.org's lists every project that
exists. Rows across those servers would compare different work and read as a ranking. The comparisons live in the tables
above, which drive one client against everyone.
| peryx | |
|---|---|
| simple index (JSON) | 78 µs ±6% (1.00x) |
| simple index (HTML) | 69 µs ±10% (1.00x) |
| project detail (JSON) | 615 µs ±43% (1.00x) |
| project detail (HTML) | 5.7 ms ±2% (1.00x) |
| legacy project JSON | 13 ms ±2% (1.00x) |
| PEP 658 metadata sibling | 107 µs ±6% (1.00x) |
| archive inspect listing | 215 µs ±8% (1.00x) |
| server CPU | 471 ms ±2% (1.00x) |
| server peak memory | 84 MB ±9% (1.00x) |
Two rows stand out, and both are the same fact. The JSON project page is served from the transformed-page cache, so it
costs a lookup and a copy. The HTML render and the legacy /{project}/json API are not cached at all: each request
parses the stored page and renders it again, which is why HTML costs about nine times the JSON page and the legacy API
about twenty. Installers ask for JSON, so no install pays this; a browser and an old client do.
Every server is measured the same way, on the same machine, in the same run, and one command reproduces every table: see run the benchmarks.
Related
- Benchmark controls and interpretation: performance and methodology
- Put the cache in front of CI: the CI guide